Understanding Your Tax Dollar: Why We Built the TaxReliefIndex Dashboard
Tax policy affects every American household — how much stays in your paycheck, what your state can fund for schools and roads, and how communities grow over time. Yet for most people, understanding the full picture of what they actually pay has never been simple or easy to access.
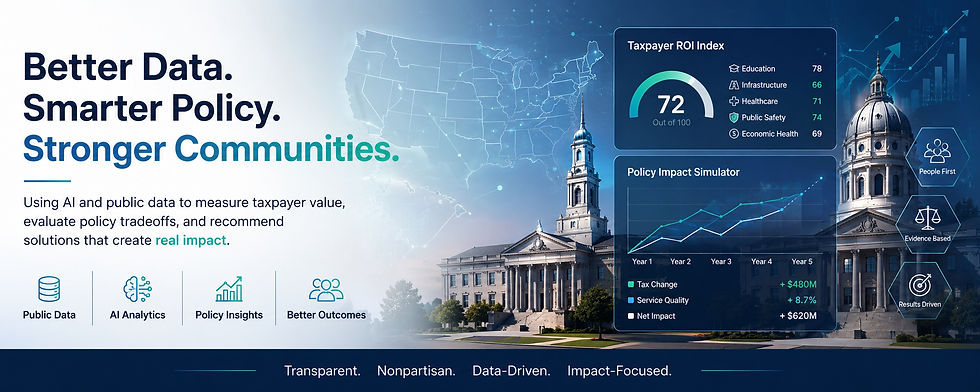
That's what inspired us to build the TaxReliefIndex — a free, interactive dashboard that brings together federal and state tax data in one place, so that everyday Americans, community leaders, and policymakers can see the full picture clearly and make more informed decisions.
The dashboard covers all 50 states across 5 income levels and 6 major tax categories, using publicly available data from the IRS, Census Bureau, Bureau of Labor Statistics, and NASBO.
What the dashboard shows:
Effective Tax Burden — what people at different income levels actually pay combining income, sales, property, and payroll taxes together. Not just the headline rate.
State-by-State Comparison — pick any two states at the same income level and see a complete side-by-side breakdown instantly. What used to take hours of research now takes seconds.
Policy Scenario Modeling — adjust any tax rate and instantly see the household impact and estimated revenue effect. Built specifically for legislators and their staff who may not have large research teams.
Spending Context — where tax revenue actually goes, per-capita by service category, for every state. See the full picture of what goes in and what it funds.
What lower-burden states actually did:
Utah spreads revenue across income, sales, and property taxes at moderate rates with lean administration — meaning more of what is collected goes to services. Tennessee uses targeted exemptions on groceries and prescriptions to protect lower-income families within a no-income-tax model. Indiana has constitutionally mandated property tax caps giving homeowners predictability as home values rise. Colorado requires voter approval for tax increases, resulting in more controlled spending growth than the national average over two decades.
Built with AI — transparently:
The TaxReliefIndex was built using AI — both in constructing the dashboard and in analyzing the underlying data. AI helped process large volumes of publicly available tax data, identify patterns across 50 states, and surface comparisons that would have taken weeks to produce manually. All data sources and methodology are fully documented.
Read the full article with interactive charts and data visuals: https://tax-relief-index.netlify.app/
By Kavya Chunduri — Derivative Systems Analyst, Systems Consultant, and founder of Capital Markets Insights. Analysis developed with AI assistance.


Comments